

Kategorie: ‘Seminars’
Data Science in Medicine WS25/26
Health data analytics is one of the main drivers for the future of medicine. Various sources of big data, including patient records, diagnostic images, genomic data, wearable sensors, are being generated in our everyday life by health care practitioners, researchers, and patients themselves. Data science aims to identify patterns, discovering the underlying cause of diseases and well being by analyzing this data.
Data Science in Medicine SS25
Health data analytics is one of the main drivers for the future of medicine. Various sources of big data, including patient records, diagnostic images, genomic data, wearable sensors, are being generated in our everyday life by health care practitioners, researchers, and patients themselves. Data science aims to identify patterns, discovering the underlying cause of diseases and well being by analyzing this data.
Knowledge Graphs Seminar SS25
Knowledge Graphs are large graphs used to capture information about the real world in such a way that is is useful for applications. In these data structures, there are all sorts of entities (for example, people, events, places, organizations, etc.). Knowledge Graphs are used by many organizations to represent the information they need for their operations. The most well-known example is Google, where a knowledge graph is used to enrich the search results. Also personal assistants, such as Amazon’s Alexa, Apple’s Siri and Google Now, as well as question answering systems such as IBM Watson, make use of knowledge graphs to provide information to their users.
Besides these, also other information graphs, are in use by large organizations to improve or personalize their services. Examples include the Facebook graph, the Amazon product graph, and the Thompson Reuters Knowledge Graph.
The graph also contains all sorts of information about these entities (e.g., age, opening hours, …) and relations between them (e.g., “this shop is located in Aachen”). Furthermore, it may contain context information (e.g., the source of some information) and schema information or background knowledge (e.g., “shops have opening hours”).
Deliverables of this seminar
This seminar consists of an introductory course on Knowledge Graphs. You will give a short outline presentation on your assigned topic to set overview and expectations about the paper you’re going to write. The main deliverable of the seminar is a paper that describes the state of the art of your assigned topic. While you do not need to contribute original research, your task is to show the scientific competences of literature research, presentation of a research question and understanding and putting relevant papers into context. Furthermore, you are asked to critically assess and compare strengths or challenges of existing solutions. You will review your peer’s papers and give relevant feedback to enhance your scientific writing skills. You will present your paper in a final presentation in a block seminar at the end of the semester.
Intelligent Data Management with Generative AI
Generative AI unlocks new potentials supporting tasks in many fields – including data management. It can significantly enhance data management by automating and improving tasks across the data lifecycle. In research data management, it supports metadata creation, documentation, and data curation. For database modeling, it enables schema generation from natural language, query formulation, and schema evolution. In data integration, it assists with semantic mapping and knowledge graph construction. It also can contribute to data quality and governance through supporting anomaly detection and policy drafting and may enhance data ecosystems by aiding cataloging and data exchange. However, the integration of generative AI into data management also presents challenges—ranging from resource efficiency and result quality to issues like bias, hallucination, and data privacy. In this seminar, you will explore a specific subtopic within this field, deepening your understanding while developing your academic writing and presentation skills.
AI Self-Reflection – Understanding How LLMs Learn from Themselves
As Large Language Models (LLMs) become more capable, researchers and practitioners are exploring whether these systems can reflect on their own reasoning, identify their errors, and improve independently.
This emerging area of AI self-reflection goes beyond self-correction. It focuses on a model’s capacity not only to revise its answers but also to reason about its own reasoning process, analyze the underlying causes of errors, and adapt future strategies.
Self-reflection is a crucial step towards trustworthy, transparent, and context-adaptive AI systems. It is becoming increasingly important in academic research and industrial applications such as AI quality assurance, error diagnosis, and model alignment.
Intelligent Data Management with Generative AI
Generative AI unlocks new potentials supporting tasks in many fields – including data management. It can significantly enhance data management by automating and improving tasks across the data lifecycle. In research data management, it supports metadata creation, documentation, and data curation. For database modeling, it enables schema generation from natural language, query formulation, and schema evolution. In data integration, it assists with semantic mapping and knowledge graph construction. It also can contribute to data quality and governance through supporting anomaly detection and policy drafting and may enhance data ecosystems by aiding cataloging and data exchange. However, the integration of generative AI into data management also presents challenges—ranging from resource efficiency and result quality to issues like bias, hallucination, and data privacy. In this seminar, you will explore a specific subtopic within this field, deepening your understanding while developing your academic writing and presentation skills.
Knowledge Graphs Seminar WS25/26
Knowledge Graphs are large graphs used to capture information about the real world in such a way that is is useful for applications. In these data structures, there are all sorts of entities (for example, people, events, places, organizations, etc.). Knowledge Graphs are used by many organizations to represent the information they need for their operations. The most well-known example is Google, where a knowledge graph is used to enrich the search results. Also personal assistants, such as Amazon’s Alexa, Apple’s Siri and Google Now, as well as question answering systems such as IBM Watson, make use of knowledge graphs to provide information to their users.
Besides these, also other information graphs, are in use by large organizations to improve or personalize their services. Examples include the Facebook graph, the Amazon product graph, and the Thompson Reuters Knowledge Graph.
The graph also contains all sorts of information about these entities (e.g., age, opening hours, …) and relations between them (e.g., “this shop is located in Aachen”). Furthermore, it may contain context information (e.g., the source of some information) and schema information or background knowledge (e.g., “shops have opening hours”).
Deliverables of this seminar
This seminar consists of an introductory course on Knowledge Graphs. You will give a short outline presentation on your assigned topic to set overview and expectations about the paper you’re going to write. The main deliverable of the seminar is a paper that describes the state of the art of your assigned topic. While you do not need to contribute original research, your task is to show the scientific competences of literature research, presentation of a research question and understanding and putting relevant papers into context. Furthermore, you are asked to critically assess and compare strengths or challenges of existing solutions. You will review your peer’s papers and give relevant feedback to enhance your scientific writing skills. You will present your paper in a final presentation in a block seminar at the end of the semester.
Knowledge Graphs Seminar
Knowledge Graphs are large graphs used to capture information about the real world in such a way that is is useful for applications. In these data structures, there are all sorts of entities (for example, people, events, places, organizations, etc.). Knowledge Graphs are used by many organizations to represent the information they need for their operations. The most well-known example is Google, where a knowledge graph is used to enrich the search results. Also personal assistants, such as Amazon’s Alexa, Apple’s Siri and Google Now, as well as question answering systems such as IBM Watson, make use of knowledge graphs to provide information to their users.
Besides these, also other information graphs, are in use by large organizations to improve or personalize their services. Examples include the Facebook graph, the Amazon product graph, and the Thompson Reuters Knowledge Graph.
The graph also contains all sorts of information about these entities (e.g., age, opening hours, …) and relations between them (e.g., “this shop is located in Aachen”). Furthermore, it may contain context information (e.g., the source of some information) and schema information or background knowledge (e.g., “shops have opening hours”).
Deliverables of this seminar
This seminar consists of an introductory course on Knowledge Graphs. You will give a short outline presentation on your assigned topic to set overview and expectations about the paper you’re going to write. The main deliverable of the seminar is a paper that describes the state of the art of your assigned topic. While you do not need to contribute original research, your task is to show the scientific competences of literature research, presentation of a research question and understanding and putting relevant papers into context. Furthermore, you are asked to critically assess and compare strengths or challenges of existing solutions. You will review your peer’s papers and give relevant feedback to enhance your scientific writing skills. You will present your paper in a final presentation in a block seminar at the end of the semester.
Dataspaces Proseminar
Inhalt
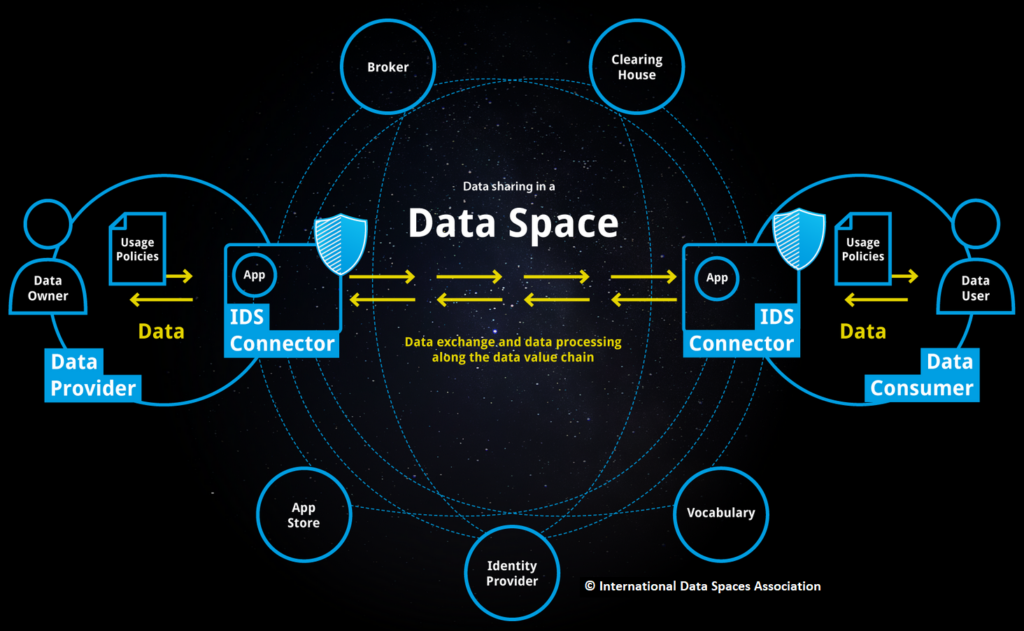
Die Anforderungen an den Datenaustausch im World Wide Web haben sich in den letzten Jahrzehnten stetig verändert. Anfangs konsumierten die Nutzer nur manuell ausgewählte Inhalte. Durch Trends wie IoT und Industrie 4.0 ist die Datenmenge exponentiell gestiegen, aber Suchmaschinen wie Google helfen dabei. Durch Social Media können Menschen auch selbst Inhalte produzieren und mit anderen teilen, allerdings meist nur über große zentrale Plattformen wie Facebook / Meta. Eine Entwicklung hin zu dezentraleren Lösungen ist seit etwa zehn Jahren im Gange, z.B. durch Blockchain. Die aktuellen Bedürfnisse im Internet sind der einfache Austausch über Domänen hinweg, Interoperabilität und vor allem Datensouveränität – also die Kontrolle über die eigenen Daten, auch wenn man sie mit anderen teilt. Dataspaces, die in Europa mit 4 bis 6 Milliarden Euro gefördert werden, adressieren genau diese Anforderungen an einen modernen Datenaustausch. In Kombination mit Semantic Web-Technologien und FAIR-Daten bieten sie vielversprechende Lösungen.
Dieses Proseminar beschäftigt sich mit Datenräumen und untersucht semantische Technologien zur Verbesserung der Dateninteroperabilität und des gemeinsamen Verständnisses. Die Inhalte umfassen grundlegende Konzepte, Prinzipien, Best Practices und Lösungen zur Verbesserung des Datenmanagements in Datenräumen.
Die Schwerpunkte dieses Proseminars sind u.a.:
- Struktur, Architektur, Entwicklung und Betrieb von Datenräumen
- Die Landschaft der > 185 existierenden Datenräume und deren Domänen
- FAIR Data, Knowledge Graphs und Linked (Open) Data als semantische Technologien für Datenräume
- Informationsmodelle als gemeinsamer Kern für die strukturierte Darstellung von Daten, Diensten, Teilnehmern und Interaktionen
- Prinzipien der Datenintegration: Verbesserung der Zugänglichkeit von Daten für verschiedene Arten von Heterogenität
- Gemeinsames Verständnis zwischen Teilnehmern: Identifikation, Vokabulare/Ontologien, Annotation, Validierung
Ablauf
Dieses Proseminar besteht aus einem Einführungskurs in Datenräume (Dataspaces). Sie halten einen kurzen Vortrag über Ihr Thema, um einen Überblick und die Erwartungen an die zu erstellende Arbeit zu vermitteln. Das Hauptergebnis des Proeminars ist eine Ausarbeitung, die den aktuellen Stand der Technik zu dem von Ihnen gewählten Thema beschreibt. Sie müssen keine eigenen Forschungsarbeiten durchführen, aber Ihre Aufgabe ist es, die wissenschaftlichen Fähigkeiten der Literaturrecherche, der Darstellung einer Forschungsfrage und des Verständnisses und der Einordnung relevanter Arbeiten in den Kontext zu demonstrieren. Darüber hinausbewerten Sie die Vor- und Nachteile bestehender Lösungen kritisch und vergleichen diese. Sie bewerten die Arbeiten Ihrer Kommilitonen (Peer-Review) und geben Feedback, um Ihre Fähigkeiten im wissenschaftlichen Schreiben zu verbessern. In einem Blockseminar am Ende des Semesters stellen Sie Ihre Arbeit in einer Abschlusspräsentation vor.
Social Computing Seminar
Social Computing embodies the intricate interplay between evolving computational systems and dynamic societal behaviors. This field examines how technology can be crafted to interpret and enhance human interactions and observes these systems’ transformative influence on our social fabric.